What is an ER Diagram and DataFlow Diagram? (11/12)
ER-Diagram
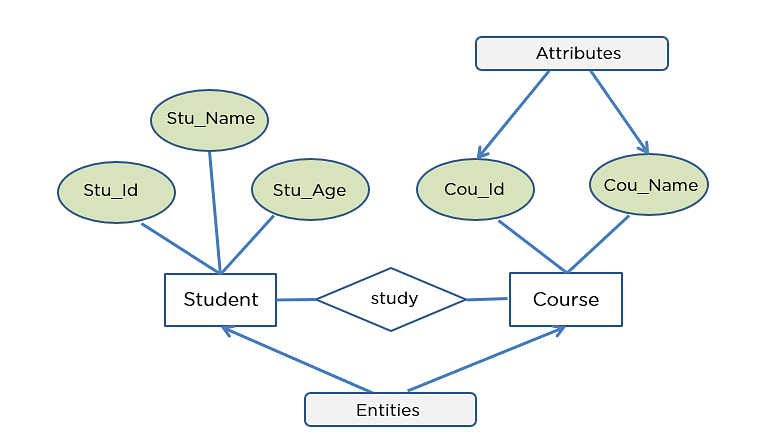
An Entity Relationship Diagram (ER Diagram) pictorially explains the relationship between entities to be stored in a database. Fundamentally, the ER Diagram is a structural design of the database. It acts as a framework created with specialized symbols for the purpose of defining the relationship between the database entities. ER diagram is created based on three principal components: entities, attributes, and relationships.
The following diagram showcases two entities - Student and Course, and their relationship. The relationship described between student and course is many-to-many, as a course can be opted by several students, and a student can opt for more than one course. Student entity possesses attributes - Stu_Id, Stu_Name & Stu_Age. The course entity has attributes such as Cou_ID & Cou_Name.
Data Flow Diagram
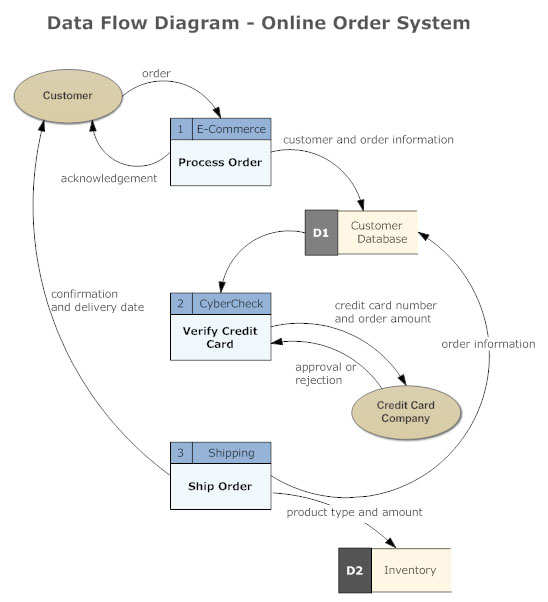
Also known as DFD, Data flow diagrams are used to graphically represent the flow of data in a business information system. DFD describes the processes that are involved in a system to transfer data from the input to the file storage and reports generation.
Data flow diagrams can be divided into logical and physical. The logical data flow diagram describes flow of data through a system to perform certain functionality of a business. The physical data flow diagram describes the implementation of the logical data flow.


Comments
Post a Comment